Lead Qualification
Feb 28, 2026
What Is a Good Reply Rate for Cold Emails in 2026?
Published reply rate benchmarks are mostly guesswork. What one real measured campaign produced, and what actually moves the number up or down.
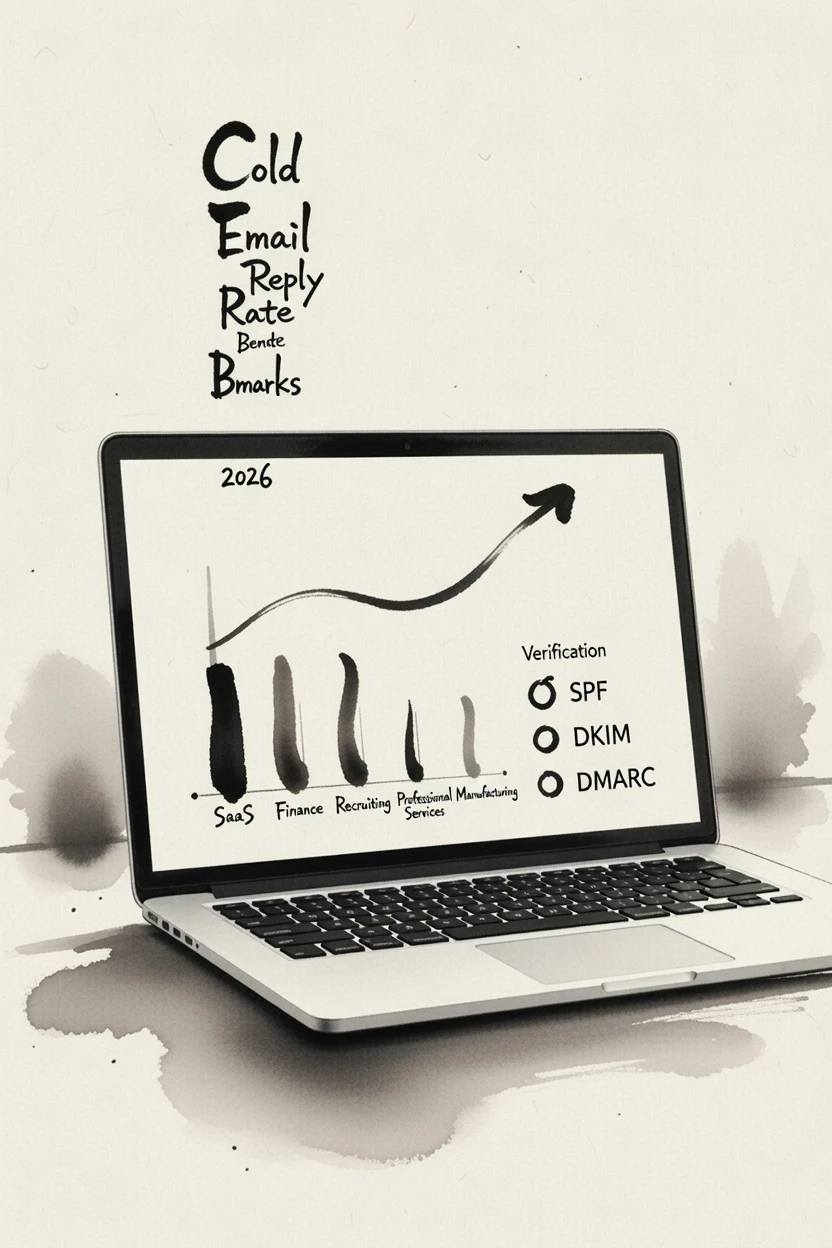
Published reply rate benchmarks are mostly guesswork, so here is a measured one instead. Across one real Lidgen programme of 35,542 contacted leads and 140,329 emails sent, 1,972 replies came back - a 5.55% reply rate per lead. Read mid-single digits as a campaign that is working, and anything under 1% as a sign something fundamental is broken, usually deliverability or relevance rather than copy.
These aren't aspirational numbers. They're based on aggregated industry data across sectors, send volumes, and sequence structures. Here's how to read them and act on them.
What Counts as a "Reply" in Cold Email Benchmarks?
This is where most benchmarks mislead you. A reply isn't just a positive response. Industry benchmarks typically count any reply - including "not interested," "wrong person," or "remove me from your list."
Positive replies, meaning people who actually engage rather than decline politely, are a fraction of that again. Tracking the two separately matters more than the headline number, because a campaign can generate plenty of replies that are all refusals.
That distinction matters because optimizing for total reply rate can push you toward aggressive or provocative subject lines that generate friction, not conversations. Your goal is qualified positive replies, not raw response volume.
How Do Reply Rates Vary by Industry?
Cold email benchmarks vary significantly by vertical:
SaaS and tech: mid-range, and the most competitive inbox of the group
Financial services: lower, with gatekeeping suppressing positive replies further
Recruiting and staffing: the highest of the group, because candidates reply more readily than buyers
Professional services: responds well, but only with genuine personalisation behind it
Manufacturing and industrial: lower, with slower cycles and less digital engagement
If you're in a low-response vertical, that's not a copy problem - it's a targeting and channel mix problem. Cold calling may need to supplement your email outreach for these sectors.
What's the Biggest Driver of Reply Rate - Copy or Deliverability?
Most teams obsess over copy when their reply rate drops. But if your emails aren't landing in the primary inbox, copy is irrelevant.
A significant share of B2B cold email never reaches the inbox at all, filtered to spam or blocked before delivery. That matters for benchmarking more than people realise: if a meaningful slice of your list never saw the message, your reply rate is being divided by the wrong denominator, and the campaign is performing better than it looks.
Before you rewrite your subject line, check:
Sender domain reputation - Are your sending domains flagged?
Authentication setup - SPF, DKIM, and DMARC all properly configured?
Warmup status - Are you sending from cold domains?
List hygiene - Are you emailing invalid addresses that inflate bounce rates?
Deliverability is the hidden killer of cold outreach campaigns - fix that layer first.
The 5 Factors That Move Reply Rate the Most
1. List precision A list of 200 hyper-targeted prospects will almost always outperform a list of 2,000 loosely matched ones. Tighter ICP = higher relevance = higher reply rate.
2. First-line personalization The opening line of your email is what a prospect reads in the preview pane before deciding to open. Generic openers kill open rates. Specific, researched first lines outperform templated openers, and the gap is large enough to be visible without a formal test.
3. Email length Data consistently shows that shorter cold emails (50-125 words) outperform longer ones. Every sentence that isn't directly serving the reader's interest reduces reply probability.
4. Sequence structure Single-email campaigns dramatically underperform sequences. A four to five touch sequence over two weeks generates substantially more replies than a single send. Most replies come from touches 2, 3, and 4 - not the first email.
5. Send timing Tuesday through Thursday, 7-9 AM or 4-6 PM in the recipient's time zone, consistently outperforms other windows. This isn't folklore - it's behavioral data on when decision-makers clear their inboxes.
What Reply Rate Should You Actually Target?
Here's a practical benchmark framework:
Scenario | Reply rate we would expect |
|---|---|
New domain, cold list, untested copy | 1-2% |
Established domain, tested ICP, decent copy | 3-5% |
Tight ICP, strong personalization, warmed infrastructure | 6-10% |
Exceptional targeting, high-value offer, niche list | 10%+ |
If you're below the benchmark for your scenario, work backward: list first, deliverability second, copy third.
How Lidgen Approaches Reply Rate Optimization
Lidgen builds campaigns from the infrastructure up - pre-warmed sending domains, real-time deliverability monitoring, and AI-guided sequence logic layered with human review before anything sends.
The result: campaigns that open in a healthy range rather than climbing out of a hole, and that improve as targeting and messaging are refined. No guessing at why your reply rate dropped. No waiting 4 weeks to warm a domain before you can test anything.
See how effective follow-up sequences are structured to maximize replies at every touch.
Why Benchmarks Mislead More Than They Help
Published reply rate figures are tempting to adopt as targets, but they hide the conditions that produced them. A number from a campaign to a small, carefully chosen audience tells you little about a campaign to a broad one. A figure that counts every response, including out-of-office messages and rejections, is not comparable to one that counts only positive replies. And figures from one industry or deal size rarely transfer to another.
For these reasons, the most useful benchmark is your own history. Track your reply rate by segment and by message over time, and use it to judge whether a change helped. A modest, steady improvement against your own baseline is more meaningful than matching or beating a number from an article, and it is much harder to fool yourself with.
Positive Reply Rate Is the Number That Matters
Total reply rate can rise while results fall. A campaign that provokes irritated responses or generates many auto-replies will look healthy on the headline figure and perform badly in practice. Splitting replies into positive, neutral and negative gives a much truer picture. A lower total reply rate with a higher share of positive responses is usually the better outcome, because those are the conversations that can become meetings.
Negative replies deserve attention too, not only because they are a warning about targeting or tone, but because they can signal risk to your sending reputation. If the share of negative responses is climbing, that is worth acting on even when the overall rate looks fine.
What to Do When Your Reply Rate Is Low
A low reply rate has a short list of likely causes, and it helps to check them in order. First, confirm the messages are reaching inboxes, since nothing else matters if they are not. Second, review who you are contacting: a poor fit between audience and offer is the most common reason for silence. Third, read the message itself as a stranger would, asking whether it is clear, relevant and easy to answer. Fourth, look at your follow-up, because many replies arrive after the second or third touch rather than the first.
Make one change at a time and give each enough volume to show an effect. Changing several things at once teaches you nothing. Over a few rounds this disciplined approach usually does more than any single clever rewrite, and it builds an understanding of your own market that no benchmark can supply. For a view of how to track this alongside other signals, see how to measure whether your outbound is actually working.
FAQ
What is a good open rate for cold emails in 2026? There is no useful answer, and that is the honest one. Tracking pixels fire from spam scanners, security gateways and privacy proxies that pre-load images, so a large and unmeasurable share of reported opens never involved a person. Score on replies instead - see why open rates should not steer cold email decisions.
Why is my cold email reply rate below 1%? Below 1% almost always points to a deliverability issue (emails not reaching inboxes), a targeting problem (wrong ICP), or emails that are too long and generic. Audit in that order.
How many follow-ups should I send to maximize replies? 3-5 follow-ups over a 14-21 day window is the data-backed sweet spot. After 5 touches with no reply, move the prospect to a reactivation sequence rather than continuing the same campaign.
Want reply rates that actually benchmark? Lidgen's infrastructure and sequencing are built to get you there without the trial-and-error. Book a demo and see the difference clean infrastructure makes.